
Read the business, not the queue
This guide is for management who use the Assentify Digital Experience Platform (DXP) to read the business without doing the day to day work. Learn to read the Dashboard, understand what every counter measures, tell in transit from dropped, and track risk from the RBA Score across the client book.
Dashboard · Funnel · Risk · BillingAbout this guide
This manual is written for management who read the business, not the queue. You will learn to read the Dashboard, understand what every counter actually measures, spot when interactions are in transit versus dropped, and track the risk picture from the RBA Score across the client book.
You do not process applications here. You read the platform. The operators, the backend teams, and the compliance function do the daily work. Your job is to read the signal in the numbers, hold the operational rhythm, and steer capacity and risk.
Signing in and around the platform
Open the DXP URL from your administrator. You can only sign in with a work email that ends in your tenant domain.
- Open the DXP URL provided by your administrator.
- Enter your work email, then press Sign In.
- Enter your password, then press Login.
- If two factor authentication is on, enter the 6 digit code from your authenticator app.
Once signed in, the left side menu shows Dashboard, Clients, Compliance Hub, Logs, and Settings. As management you will mostly use Dashboard, Compliance Hub, and Settings (Billing Management).
The flow in one picture
A client interaction has a fixed lifecycle on the platform. Knowing it lets you read every Dashboard number correctly. The Dashboard shows live counts for each state per flow and across flows.
| State | What it means |
|---|---|
| Engagement | Client facing steps: Block Loader, Identification Document Capture, Face Image Acquisition, Assisted Data Entry, and similar. |
| In Transit | The interaction is in flight. Either the client is still walking through it, or it was submitted and is moving through Connector and Backend steps. |
| In Progress on a Backend Block | A human is reviewing the application. |
| Decided | An Approve, Decline, or other configured decision was taken. The interaction leaves the queue. |
| Dropped | The client abandoned the flow before submitting. This is the number to watch for friction. |
How the modules fit together. The Dashboard is analytics. It feeds from three modules. Interactions holds the per-flow interaction lists, each with a configure icon that maps which fields show in an expanded interaction row. Clients is the register with KYC and AML status. Compliance Hub runs the screening and adjudication behind the risk numbers. To see how flows are built, use the Flow Builder guide. For roles and billing, use the Admin guide.
The Dashboard, card by card
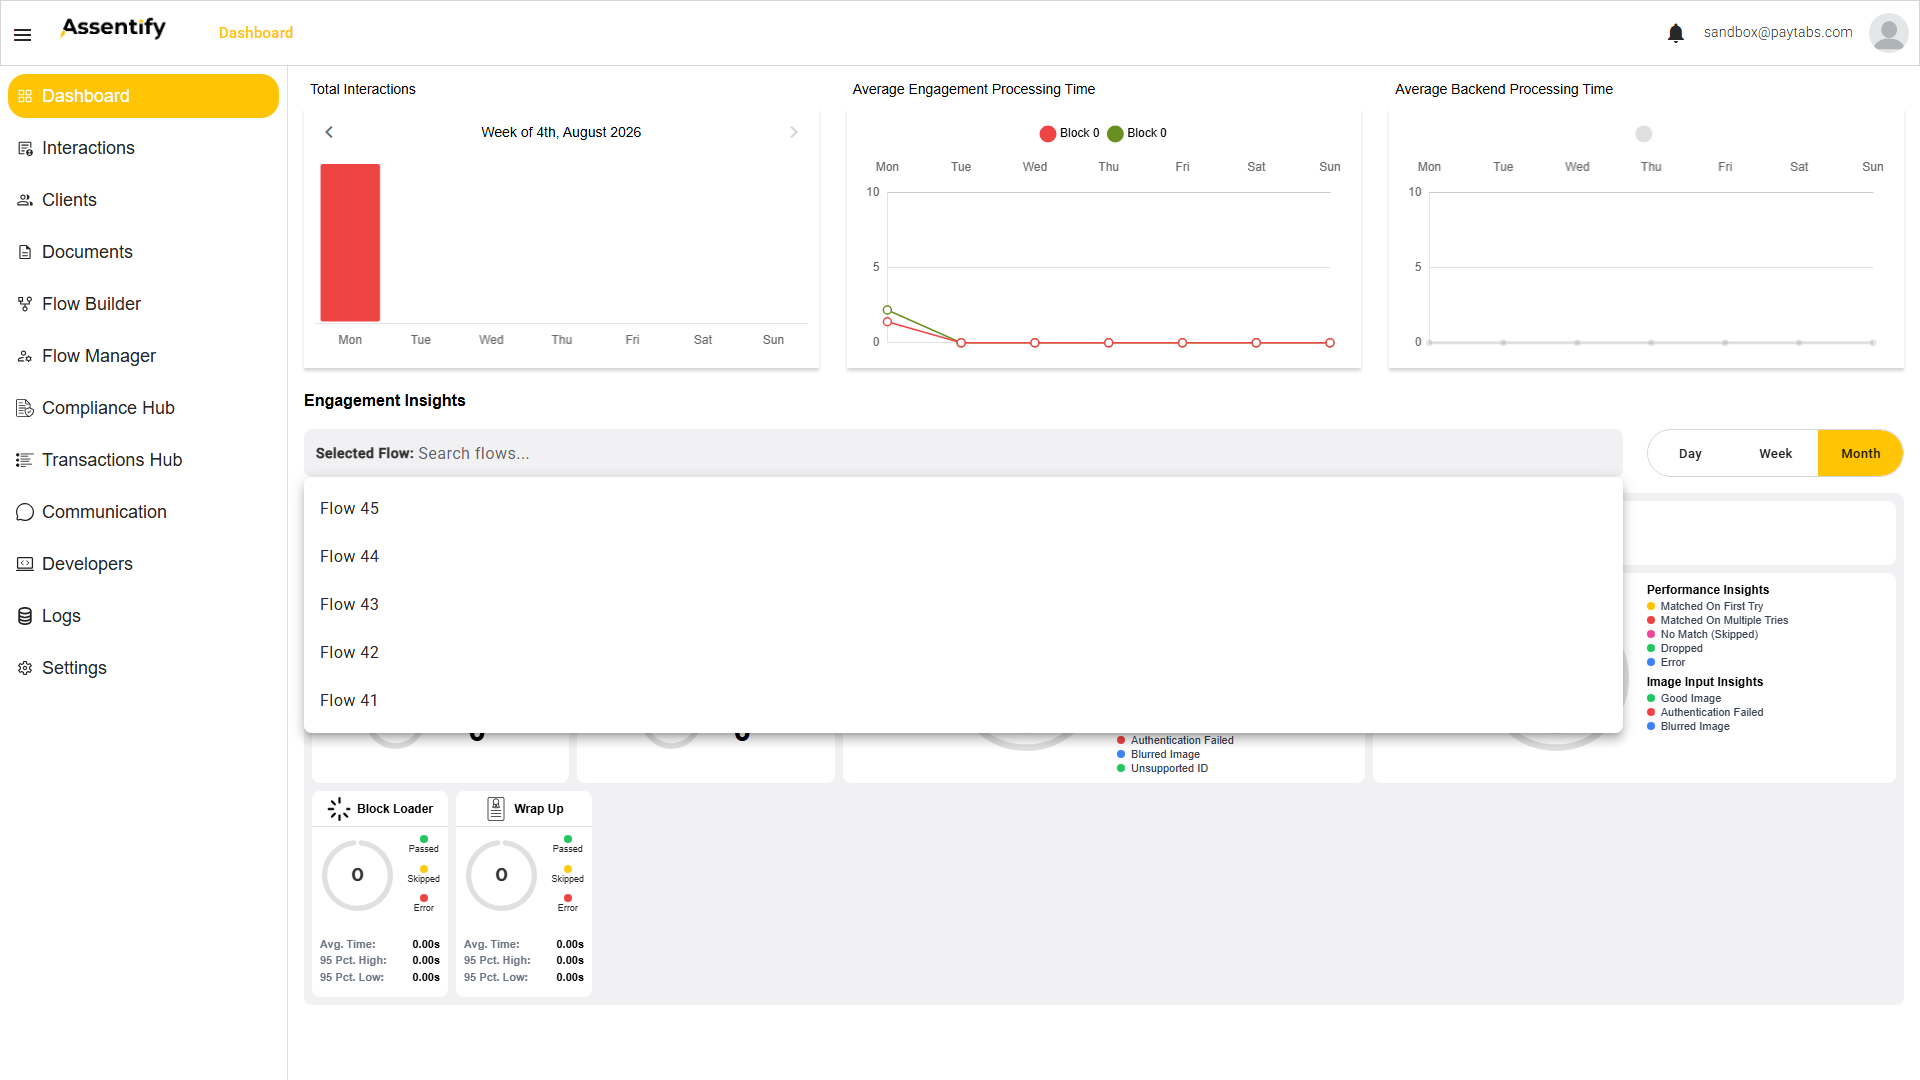
What it is. Your at a glance view of the platform. Read it top to bottom: volume and speed at the top, then per flow insights, then the capture donuts, then the first and last engagement steps.
How the surface is split. The top row is tenant wide. The lower band is per selected flow. Pick a flow in Selected Flow to populate the lower band, then use the Day / Week / Month toggle to set the range. On the In Progress and Dropped donuts, hover to reveal an eye or view control. That control drills from a number into the underlying interaction records, so you can go from a count to the exact sessions behind it. The same records are also reachable from the Interactions module.
Top row: volumes and speed
| Card | What it measures |
|---|---|
| Total Interactions | Weekly bar chart of engagement sessions for the selected week, with a back and forward week pager. |
| Average Engagement Processing Time | Time clients spent inside the Engagement Block, shown as a line chart per block (Block 0, and so on) by weekday. A short value means clean flows. A long value usually means a friction step. |
| Average Backend Processing Time | Server-side backend time, shown as a line chart by weekday. Your operational SLA reading. |
Engagement Insights
The lower band is per flow. Set the flow and the window before you read the counts.
- Pick the flow from the Selected Flow search box. Type in the Search flows... box, then choose the flow from the selector.
- Pick the window with the Day / Week / Month toggle.
- Read the status donuts below against that flow and window.
After a flow is selected you see three status donuts. These are the funnel at a glance for the chosen flow.
| Donut | Meaning |
|---|---|
| Completed | Sessions that finished the whole journey. |
| In Progress | Sessions still open. Hover for the eye control to drill into the list of in-progress sessions. |
| Dropped | Sessions abandoned before completion. This is your funnel leakage. Hover for the eye control to list the dropped sessions and inspect why each dropped. |
The per-step ID and Face figures do not live here. They sit in the Performance Insights and Image Input Insights panels covered in the next section.
Performance Insights and Image Input Insights
Two pairs of donuts. ID first, Face second. Each pair shows Performance Insights (how the step performed) and Image Input Insights (what the camera produced). Read the categories exactly as named below.
ID Performance
Success on first try, second try, third try, after three tries, No Auto Capture, Dropped, Error.
ID Image Input
Good Image, Authentication Failed, Blurred Image, Unsupported ID.
Face Performance
Matched on first try, multiple tries, No Match (Skipped), Dropped, Error.
Face Image Input
Good Image, Authentication Failed, Blurred Image.
Per-step timing
At the bottom of the Dashboard, a card for every engagement step in the flow shows its timing. Block Loader and Wrap Up appear, and so does every other step in between: ID capture, Face, Assisted Data Entry, and the rest. Each card shows Passed, Skipped, Error, plus Avg Time, 95 Pct High, and 95 Pct Low in seconds, so you can see exactly which step slows clients down.
| Field | What it tells you |
|---|---|
| Passed | Interactions that cleared the step. |
| Skipped | Interactions that bypassed the step. |
| Error | Interactions that failed at the step. |
| Avg Time | Mean time on the step in seconds. |
| 95 Pct High / 95 Pct Low | The slow and fast ends of the 95th percentile band, in seconds. |
The funnel: in transit, dropped, decided
When you compare the same week to last week, watch three numbers together.
- Read Engagement starts, the Total Interactions including in transit.
- Read Dropped from Engagement Insights, the leak in the funnel.
- Read Completed (Decided) from Engagement Insights.
- Check the math below; a mismatch means an integration is silently failing.
- Open Logs to find the failing integration when the equation does not balance.
Engagement starts minus Dropped minus In Progress equals Decided
If the equation does not balance, you have an integration silently failing. The Logs section will show the failures.
Reading risk: RBA, Client Clear, matches
Two surfaces tell you the size of your risk book.
- Open Compliance Hub, then Client Clear.
- Read the profile-type tabs at the top for counts per profile type.
- Read the RBA Score column to see how risky the book is at a glance.
- To size a tier, open Clients from the side menu.
- Filter by Risk Level (Low, Medium, High) for the live count at each tier.
The Clients table. Its columns come from the Client Profile mapping: Client ID, Email, Phone Number, Birth Date, Name, Time started, and Time Ended, plus KYC and AML status. Controls include Export, search, and Filters. So you can filter to a Risk Level, size that tier, and export the list for a review pack.
Screening freshness and audit proof
Two questions the board asks most: how fresh is our screening, and can we prove the process to the regulator. Both are answered inside the Compliance Hub.
- Open Compliance Hub, then the Status sub-module.
- Read the last update per list; the default refresh is every 6 hours.
- For an audit trail, open Audit Hub and run the end of day export.
- For a flagged client, open Clients and export the AML Screening History.
How a match is generated. The hub screens each entity across many watchlists, for example UsOfacSdn, InterpolRedNotice, and UkOfsiTargets. It uses Agentic AI name variations to catch aliases and transliterations, so a misspelled or transliterated name still matches. Each match record carries a Score, Name, Alias list, and Country. Read these to judge screening quality, not just freshness.
Prove the process. The Compliance Hub Export Report offers Export To CSV and Export To Excel. In Logs, the Audit Type splits into User Activities and System Audit, with Created, Activity Type, User Name, and Message columns plus Export. That log answers the board's "did anyone bypass the process" question directly.
Operational rhythm
Run the platform on a steady cadence. This table sets who does what and when.
| When | What | Owner |
|---|---|---|
| Every morning | Open Dashboard. Scan In Progress, Dropped, and AML matches. | COO or Head of Ops |
| Weekly Monday | Compare the past week to the prior week. Look for Performance Insight shifts. | Head of Digital |
| Weekly Friday | Compliance Hub Audit Hub export reviewed and signed off. | Head of Compliance or MLRO |
| Monthly | Billing Management review. Quota burn versus quota allowance. | Finance and COO |
| Quarterly | Roadmap discussion with Assentify Customer Success. | COO and Assentify CSM |
Billing and Usage
Open Settings, then Billing Management. The top right card shows Your Usage with subscription type, Total Allowed, Total Consumed, Total Over, and a donut for percent consumed.
- Open Settings, then Billing Management.
- Read the Your Usage card: subscription type, Total Allowed, Total Consumed, Total Over.
- Read the donut for percent consumed to judge quota burn at a glance.
- Scroll to the invoice table for finance forecasting and renewal planning.
Monthly Subscription
Fixed monthly quota. Overage is charged per transaction.
A prepaid package. Processing stops when the package is exhausted.
The invoice table at the bottom lists these columns.
| Column | Use |
|---|---|
| Invoice Id | Reference for the billing period. |
| Month Of | The billed month. |
| Total (USD) | Amount due in US dollars. |
| Interactions | Volume billed in that period. |
| Status | Paid or outstanding. |
Common questions from the board
| Question | Where to answer it |
|---|---|
| How long does our eKYC take? | Average Backend Processing Time on the Dashboard. |
| How many clients are flagged for AML? | Compliance Hub > Client Clear profile-type tabs show live counts per profile type. |
| How fresh is our screening? | The Compliance Hub Status sub-module shows last update per list. Default is every six hours. |
| Are we paying for capacity we do not use? | Yes if Total Consumed sits well below Total Allowed for several months. |
| Did anyone bypass the process? | Logs section, filter by user and action type. Audit Hub for compliance specifically. |
| How big is our high risk book? | Clients section, filter by Risk Level High. Or Client Clear, RBA Score column descending. |
Scaling up
When the business grows, these are the levers and who pulls them.
| Goal | How |
|---|---|
| Add a flow | Talk to your Flow Manager. New flows can go live in days. |
| Add a language | Arabic is built in. Other languages need Assentify Customer Success to enable. |
| Add a backend team | Create a new Backend Block in the relevant flow. |
| Add a list | Your Compliance team can add custom lists in minutes. |
| Add a profile type | Settings > System Configuration > Client Profile Types. |
| Add a transaction monitoring rule | Settings > RTRA Engine Configuration. |
Roles and permissions
The DXP supports custom roles built from claims dragged into a role definition. The recommended starting roles for this audience are below. Your administrator can adjust the claims to match your operating model.
| Role | Recommended access | Typical tasks |
|---|---|---|
| Head of Operations / COO | Dashboard, Logs read, Billing read. | Daily Dashboard scan, weekly review. |
| Head of Digital | Dashboard, Flow Manager read, Theme Builder read. | Owns flow performance, branding, and language pack expansion. |
| Head of Compliance | Compliance Hub (all four sub-modules), AML Management, Clients, Logs export. | Owns the weekly compliance pack, regulator submissions, custom list policy, and RBA setup. |
FAQ and support
| Question | Answer |
|---|---|
| Is the Dashboard real time? | Yes. New interactions and decisions roll in live. |
| Can I export to Power BI or Tableau? | Yes, through the Developers section. The Solution Architect can wire the API. |
| How do we prove compliance to the regulator? | End of day Audit Hub export, plus AML Screening History from the Clients section for any flagged client. Both are timestamped, signed, and exportable. |
| Where is our data stored? | Settings, System Configuration. Data Persistence selects On Cloud or On Premise. |
| Can I get an SLA? | Yes, through Enterprise tenancies. Talk to Customer Success. |
Glossary
The terms behind the numbers on your Dashboard.
| Term | Definition |
|---|---|
| AML | Anti Money Laundering. |
| Application Command | The default step inside a Backend Block. Holds Automated Processing, Pre-Processing, decisions, and the Interactions table configuration. |
| Backend Block | Where collected interaction data is reviewed and decisioned. |
| BI | Business Intelligence. |
| Client | A natural person or business stored in the Clients section. |
| Compliance Hub | AML, sanctions, PEP, and watchlist module. Four parts: Workspace, Client Clear, Audit Hub, Status. |
| Connector Block | The block that updates status, sends notifications, creates clients, and pushes data through webhooks. |
| DXP | Digital Experience Platform. The Assentify product. |
| Digital Engagement | A flow exposed to clients via a link, QR code, or SDK. |
| Engagement Block | The client facing block with capture and signing steps. |
| Flow | An end to end journey built in the Flow Builder. |
| Funnel | The path a client takes from start to submitted application. |
| Inline Compliance Hub | The AML screening panel that appears inside an expanded interaction row. |
| Interaction | One client submission travelling through a flow. |
| PEP | Politically Exposed Person. |
| RBA Score | Risk Based Approach score. A numeric score from the Risk Based Approach engine. |
| RTRA | Real Time Risk Assessment. The engine that monitors client transactions after onboarding. |
| Run rate | Projected end of period cost or volume. |
| Screening Profile | A named configuration of which lists and which weighted algorithms run for a given context (Interactions, Client Clear, Workspace). |
| Tenant | An Assentify client organization. |
| eKYC | Electronic Know Your Customer. |